
Options Analysis
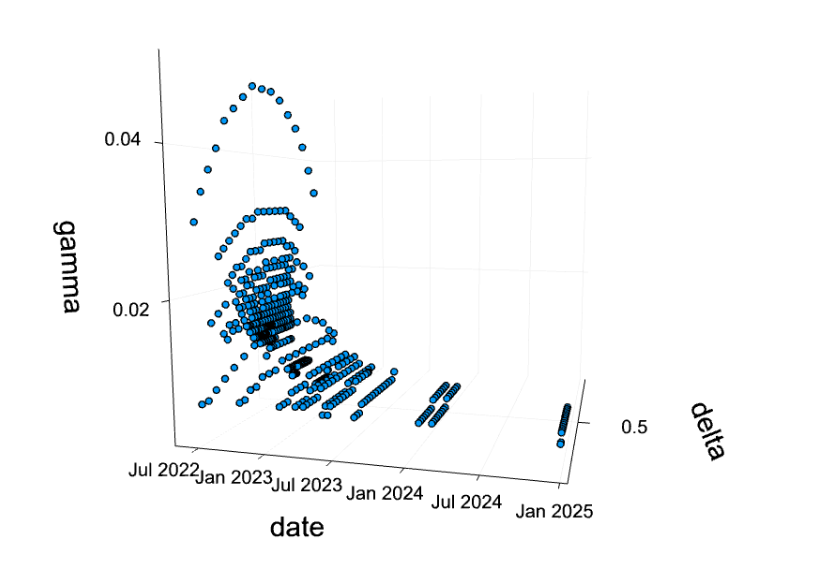
Anyone studying options for long enough begins to wonder about how the Greeks interact. Like, sure, an option’s delta approaches 0 or 1 (depending on its moneyness) as it gets closer to expiration, but what happens to its gamma, as it gets closer to expiration? Does that depend on its delta? Natenburg goes a bit into this with a plethora of graphs in his textbook. The unfortunate thing about books is that they’re all 2D and noninteractive.
I decided to see what I could spin up with Julia and a bit of elbow grease. I grabbed the latest option chain with TD Ameritrade and got to work. (At the time of these graphs, SPY was trading near $419.) Behold, some graphs:
Gamma in response to Time and Delta:
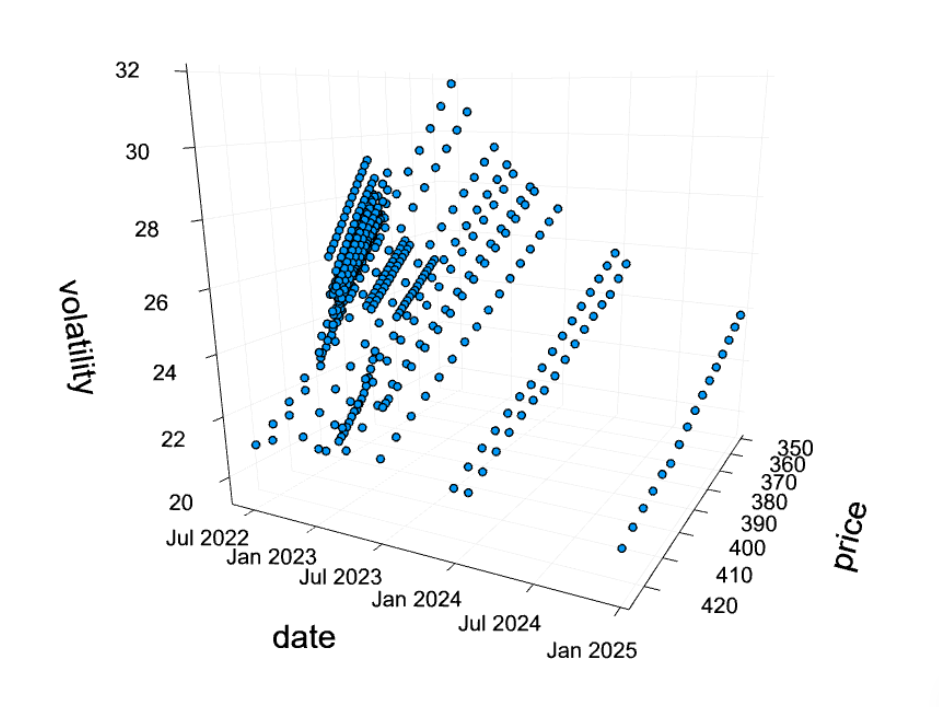
Volatility in response to Time and Price (aka Vol Smile)
If you’d like to play with this, feel free to play around with the repo.