
Note 1 - Intro to Options
Table of Contents
Why Do Options Exist?
Options (and futures) have had a well-established history outside of the financial markets. They originated with commodities for people to guarantee a consistent and predictable profit from their crops (which could be subject to weather conditions), and for people on the other side of the trade to make outsized bets on stock they did not own. Eventually, they made their way to the stock market as a method for hedging and speculation, and have since continued to dominate a considerable part of the new Robinhood crowd’s trades.
In the financial markets, options are a class of financial derivatives, meaning that their value is based on the value coming from another asset. In this case, the “other asset” we will describe in this guide is stocks, but do note that options exist for many other assets, including futures, interest rates, and even options.
This guide will aim to take a conversational tone, assuming knowledge in Calculus and basic probability, and it will be more math-heavy and concrete than other introductions. First, I will explain the options’ original uses to hedge, then followed by more and more complicated methods to use this asset class.
The House
Let’s start with a simple, real-life example (with non-real-life numbers):
Suppose I buy a house for $1000 as an investment. I’m scared that one day, a flood will hit my house, and its value will fall to 0. As a result, I go out and buy flood insurance costing me $100 that protects me against the flood for a year, promising to pay me back all losses incurred if the value of the house falls under $800. Our resulting investment looks something like this, with \(V\) being the value of the house:1
\[V' = \begin{cases} V-$100 & ,V \geq $800\\ V-$100 - $1000 + ($800 - V)= $700 & ,V < $800\\ \end{cases}\]
This chart illustrates the payout we would get with and without insurance. The x-axis represents the value of the house, and the y-axis represents the payout. The purple line is without insurance, and the blue line is with insurance.
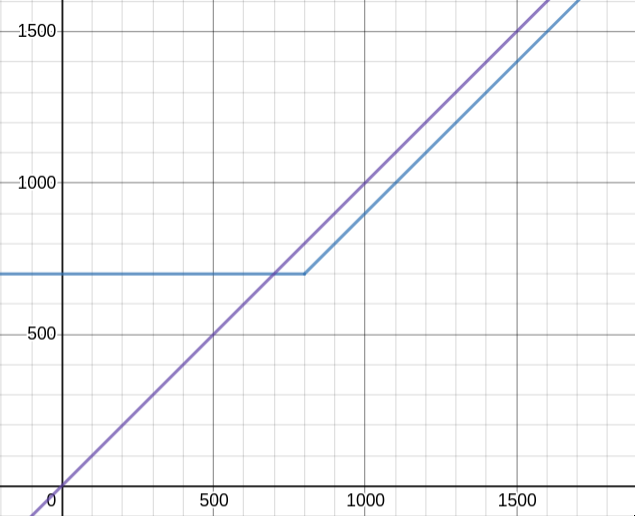
As easily seen from this scenario, we are capped at a max loss of $300, no matter what happens to our house. We pay a specified amount, the premium (in this case, $100), as protection that expires on a particular date, the expiration date (in this case, one year). Note also that there is a price, the strike price at which the insurance has value (in this case, $800).
Whew. That was a lot! Let’s quickly recap, to make sure we’re on the same page. We have a house, valued at $1000. We buy insurance on the house for $100 (the premium), having effect for one year (so the expiration date is one year), promising to pay us any losses if the value of the house falls under $800 (the strike price).
Ok! So why does this all matter? Well, let’s take a look. We changed our initial investment in this house from a maximum loss of $1000 to a fixed payout of $100 per year, and a maximum loss of $300 when an event does happen. In effect, we’ve traded our risk for a fixed amount of capital. That is the basis for options.
The Types of Options
Today, we will cover a brief overview of options. The two types of options are call options and put options.
Put Options
Put options give the buyer of the option the right to sell a stock at a fixed price, in effect giving an insurance on the stock. The best way to understand this is through an analogy to the house insurance from before:
Suppose we buy 100 shares of a stock at $10 each, totaling $1000. We’re scared that our investment might fall to 0, so we buy a put option with an expiration of 1 year for our 100 stocks at a strike price of $8, with each option costing us $1. This gives us the right to sell this stock at $8 at any time before the expiration date. Again, let us look at our payoff diagram. Here, \(V\) is the value of our holdings, and \(S\) is the value of the stock.
\[V = \begin{cases} S-$100 & ,S \geq $800\\ S-$100 - $1000 + ($800 - S)= $700 & ,S < $800\\ \end{cases}\]Hmmm… that seems familiar! It has the exact same payout as the insurance on the house! Let’s elaborate.
The premium of the house has translated directly to the cost of the put option contract. The “safety net” of the house insuring all losses incurred by the house’s value falling below $800 has been replaced by the right to sell the stock at any time at $8. Since the market buys puts in multiples of 100, this gives us the right to sell our $1000 total assets at $800 at any time. The expiration date concept has remained the same.
If you’re confused at this point, I recommend you to think through the parallels between the housing insurance and this example, and to ensure you understand this concept before you move on! All concepts from here on out will be building on this simple example.
Call Options
Now that we understand put options and its use – to hedge a long position, we turn to the other side: shorts. Call options are the analogue of put options, allowing us to sell a stock at any time for a fixed price, in effect giving an insurance on the stock in case it moves too high. And here’s a similar example:
Suppose today we short 100 stocks at $10 each, totaling $1000. We’re scared that the investment might shoot up to infinity (in effect giving us infinite losses), so we decide to buy a call option with an expiration of 1 year for our 100 stocks at a strike price of $12, with each option costing us $1. This gives us the right to buy the stock (and cover the short) at any time before the expiration date. Again, a payoff diagram. Note that here V stands for our total gains if we were to close out the short position. 2
\[V = \begin{cases} ($1000 - S) - $100 = $900 - S & ,S \leq $1200\\ ($1000 - S) - $100 - ($1200 - S) = -$300 & ,S < $1200\\ \end{cases}\]
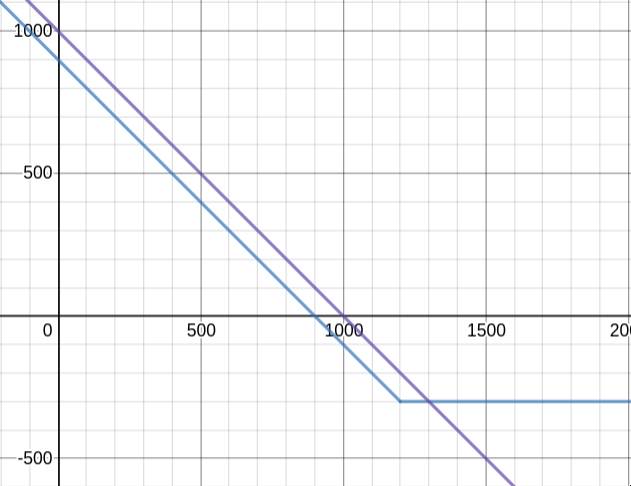
Again, we have capped our max losses at -$300, a huge reduction from possibly losing an infinite amount of money! On the downside, when we earn, a $100 chunk is taken out to serve as insurance. But that’s the intention – we’re trading risk for a fixed payment.
A short note: you may be wondering why the two graphs don’t really match up. For the house and the put options, the owned asset was not sold at the end of the simulation, but for the call option, the short position was closed. Therefore, to match up the two graphs, simply add 1000 to the call option graph, and the graphs will be comparable.