
Random Fact #3
Today’s Fact: Linear Discriminant Analysis
Linear Discriminant Analysis, or LDA for short, is an ML model used in classification. Specifically, for a model of d features and n training points, it assumes that the d features are all distributed Normally (Gaussian), with the same variance. More formally, taken from my professor’s cs189 notes, we get:
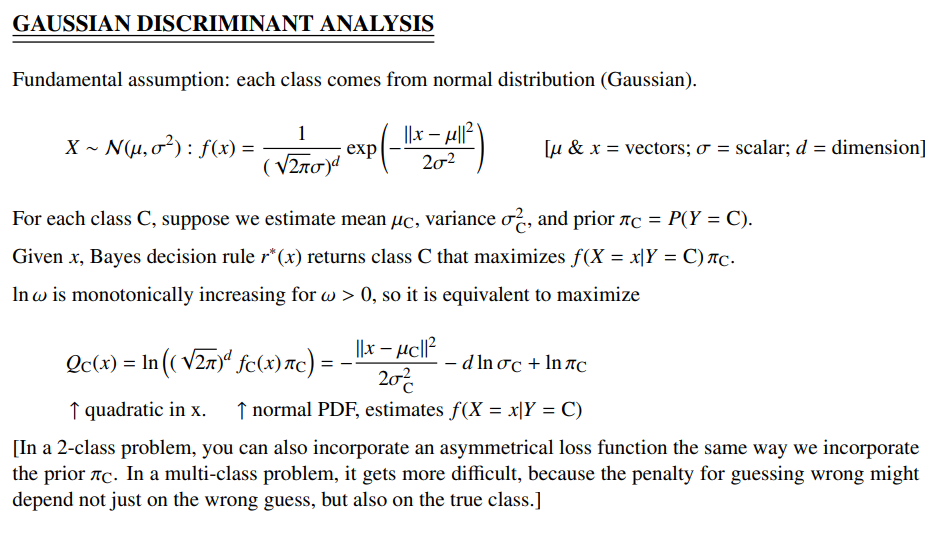
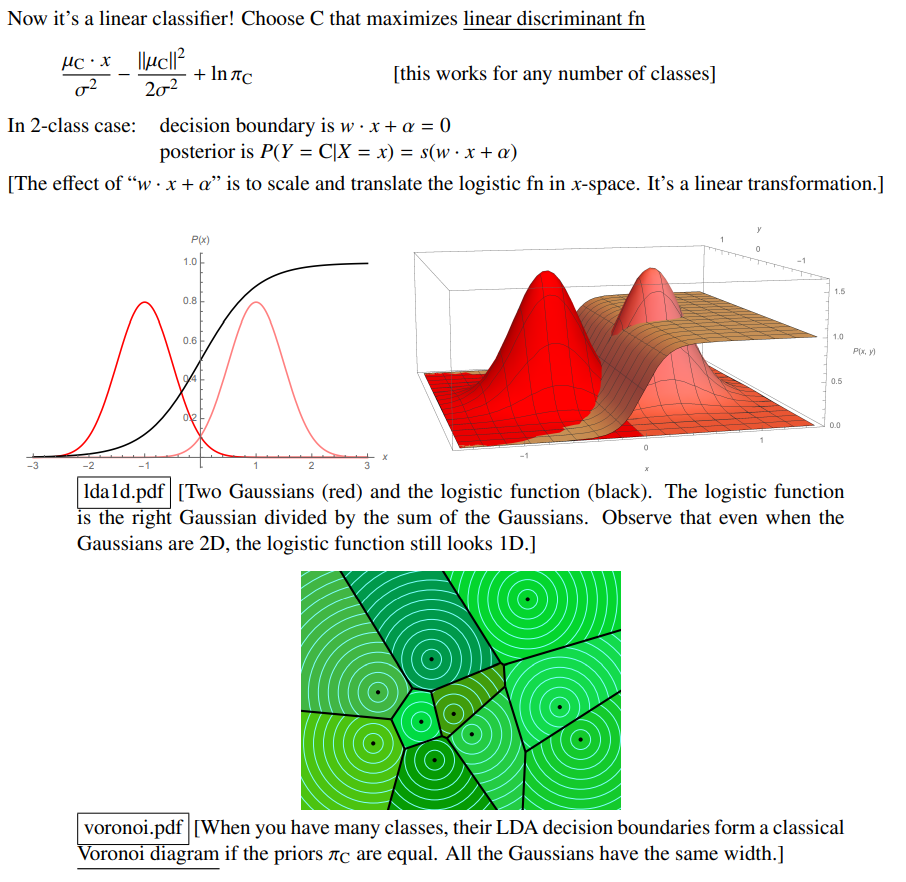
This doesn’t help much for those who are unfamiliar with Machine Learning, so he also included helpful diagrams. Below is a two-class classification (imagine your input is either of class A or class B, and you’re deciding which class it’s supposed to be in). The decision function (breaking point between choosing A versus B) is the black line; less than 0.5 indicates a stronger guess towards the left side, and greater than 0.5 indicates a stronger guess towards the right class. Below that, we have a multi-class problem, where each class’s boundaries are broken up by black line:
When Andi saw this, he immediately thought of k-means clustering, which is a type of unsupervised learning meant to cluster similar data without knowing their actual labels. K-means often uses similar voronoi diagrams to represent its output, so he raised a question: How does K-means compare to LDA, even though they fundamentally were quite different (supervised vs unsupervised, classification vs grouping)? And so we simulated it.
Simulation
First, we examined the case of Normally distributed data that is decently spread out from each other, like so:
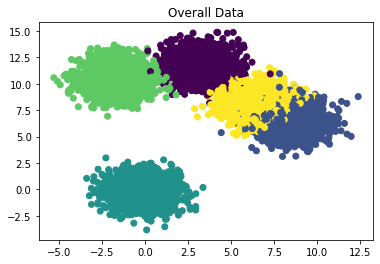
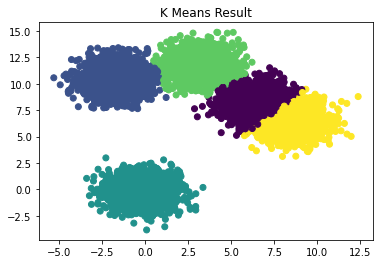
Here, we see that LDA and KMeans actually (somewhat surprisingly!) performed about the same:

Now, we looked at the case where data is overlapping, like so:
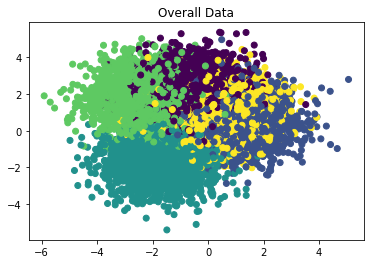
We see that the results are different this time (!):
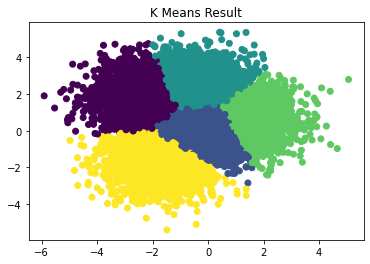
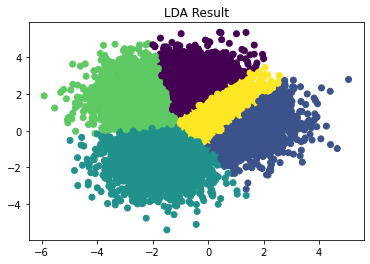
Notice that in the second case, where there are overlapping data, LDA still learns of a distinction between class Yellow and class Purple. K-means completely lost it there, since it has no idea what the labels are supposed to be. This is expected, since K-means is intended to group similar data, not learn things like this. We thought that it was quite interesting that K-means performed as well as it did in part 1.